As we know,
we can do Oracle Service Bus development by two ways, either we can use SB
Console or we can use Eclipse IDE. There are many features available in Eclipse
that we don't see in SB console and one of it is Debugger. In Eclipse there is
visual debugger available that helps us to debug the proxy service message
flow. In this post, we see how to use Eclipse debugger and debug simple proxy
service message flow. For this post, we have prepared one sample project, that
contains one business service that further invokes external service and we have created a wrapper proxy service for that business service. In the message
flow, we have used route node to route the message to business service and
added log activity to log the request message.
Before we start debugging proxy service message flow, we
need to ensure that server is running in debug mode. If it not then we need to
restart it in debug mode, for that first open the server view by going to
Window -> Show View -> Servers. This opens the server view, to restart server
in debug mode, right click on the server and click on "Restart in
Debug" option. Once server restart complete , you notice server state is "Debugging,
Synchronized".
Next step is to add toggle breakpoints, toggle
breakpoints are added in the message flow where we want to stop our flow and
validate it. We add two toggle breakpoint in this flow, one for Log action and
other for routing action. To add toggle breakpoint for log action, right click
on Log action and choose "Toggle Breakpoint" and repeat same step for
routing action. Once done we see two
toggle breakpoints in message flow as highlighted in below diagram. There is no
limit, we can add as many as toggle breakpoints in your message as per need.
Now we test the proxy service from Eclipse and debug the
proxy service message flow. To do that right click on proxy service , click on
"Run As" and choose "Run on Server" and then later click on
finish to start the testing. You can also run this proxy service from SB
console or SOAP UI.
Once we click on finish, below window will come, in that
window choose last option "Continue in the current mode".
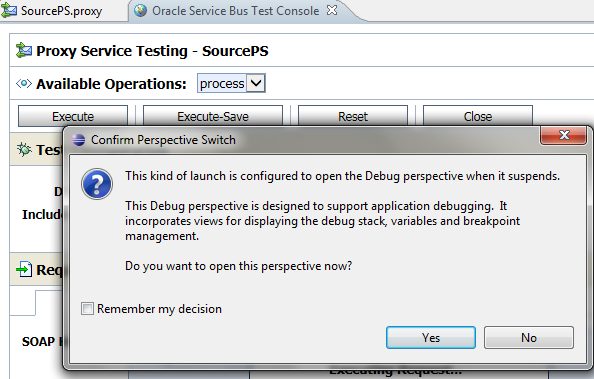
This opens the Test console window and it asks you to
confirm the perspective switch, confirm it and click on "remember my
decision". Enter the request message and click on execute, once you click
on execute, flow stops at first toggle breakpoint in the message flow and that
toggle breakpoint highlighted by green arrow as shown in below diagram. You see
options to toggle in , out and resume as shown in below diagram.
You can also check the content of the variable during
this debugging and even though we can also change the content of the variable.
Once you run all toggle breakpoints , you will see response of test console.


0 comments :
Post a Comment